PCE inflation comes in as expected … volatility is the new normal … Jeff Clark's bullish indicator … a flashing recession warning … context for this market weakness The good news is that today’s inflation report – the Personal Consumption Expenditures (PCE) Price Index – met market expectations. This prevents bears from having a new reason to push stock prices lower. The bad news is that the report showed inflation remaining well above the Fed’s target of 2%. Translation – don’t expect rate cuts soon… Diving into the details, the PCE index climbed 0.3% in January, notching a 2.5% year-over-year rate. Core PCE, which excludes food and energy prices, also rose 0.3% for the month and came in at 2.6% annually. All these figures were in line with consensus estimates. The more interesting part of the report had to do with incomes and consumer spending. Here’s CNBC: Personal income posted a much sharper increase than expected, up 0.9% on the month against expectations for a 0.4% increase. However, the higher incomes did not translate into spending, which decreased 0.2%, versus the forecast for a 0.1% gain. The personal savings rate also spiked higher, rising to 4.6%. This reflects what we’re seeing in the markets today: fear stemming from uncertainty. From interest rates, to tariffs, to inflation, to public policy – you name it – there are abundant “what will happen?” question marks overhanging stocks today. And that means one thing… Volatility. Get used to stock market volatility That’s the recommendation of our hypergrowth expert, Luke Lango, editor of Innovation Investor. From Luke: Stocks have swung violently higher and lower many times over the past several months. In that time, we’ve seen just 5% gains in the S&P 500 and a negative return from the small-cap Russell 2000. Is this intense volatility Wall Street’s ‘new normal’? It may be. I still think stocks are going higher in 2025. However, I don’t think it’ll be a smooth ride higher – largely because of U.S. President Donald Trump. To be clear, it’s not Trump himself. Rather, Luke notes that it’s the uncertainty Trump brings to the market. Wall Street hates uncertainty. Market fog makes it challenging for analysts to run their earnings projections and for money managers to position their clients. This results in market whipsaws (quick, violent moves up and down) as Wall Street reacts to shifting headlines and new data. But as Luke noted, this might be our new normal: We think this will be the pattern for the stock market for the foreseeable future: two steps forward, one step back. Lather, rinse, repeat. That means a lot of volatility on Wall Street… Now, volatility isn’t necessarily bad. For traders, it’s the fuel that drives profits. And for long-term investors, while frustrating, it can also present great buying opportunities. For a detailed roadmap of how Luke plans to play this Trump-based volatility, check out the free presentation he just put together. It covers: - Luke’s five-point game plan for how Trump’s policies could shape the economic landscape
- How these policy changes might influence your money over the next four years, including when the boom becomes a bust
- The sectors best positioned for exponential growth under the Trump
In the meantime, keep your Dramamine nearby. This volatility looks to be sticky. | Recommended Link | | | | We studied 125 years of market history and 5.2 billion data points, developing a brand-new algorithm. But there’s a reason we didn’t cut corners. For the first time, our advanced algorithm — made possible by a brand-new technological breakthrough — points to a once-in-a-generation opportunity to build wealth in 2025. Here’s everything you need to know about the “mega melt-up.” |  | | But if one of Jeff Clark's trading indicators is right, we're getting closer to the good "upward" kind of volatility For newer Digest readers, Jeff is a market veteran with more than four decades of experience. In his service, Jeff Clark Trader, he profitably trades the markets regardless of direction – up, down, or sideways. He uses a suite of momentum indicators and moving averages to provide clues about where stocks are going next. And one of them suggests we’re getting closer to a bullish breakout. Here’s Jeff from his Wednesday update: The Volatility Index (VIX) is about to generate its first “buy” signal of 2025. The VIX gave us eight buy signals in 2024. All of them came within a day or two of at least a short-term low in the stock market. And all of them were good for a rally of at least 100 points in the S&P 500. This “VIX Indicator” triggers when the index closes above its upper Bollinger Band and then closes back inside the bands. To make sure we’re all on the same page, Bollinger Bands help gauge a stock’s volatility to determine if it’s over- or undervalued. This can inform entry and exit timing in a trade. Back to Jeff for how to read Bollinger bands in the context of the VIX: Whenever a chart moves outside of its Bollinger Bands, it signals an “extreme” condition – which is vulnerable to a reversal in the other direction. In the case of the VIX, these extreme conditions trigger buy and sell signals for the broad stock market. The last time this indicator triggered was mid-December. The S&P 500 was trading near 5880. One week after the trigger, the index was above 6000. On Monday, the VIX closed above its upper Bollinger Band for the first time this year. Below is a chart showing how that looked, from Jeff’s update. You’ll also see the trigger from mid-December. 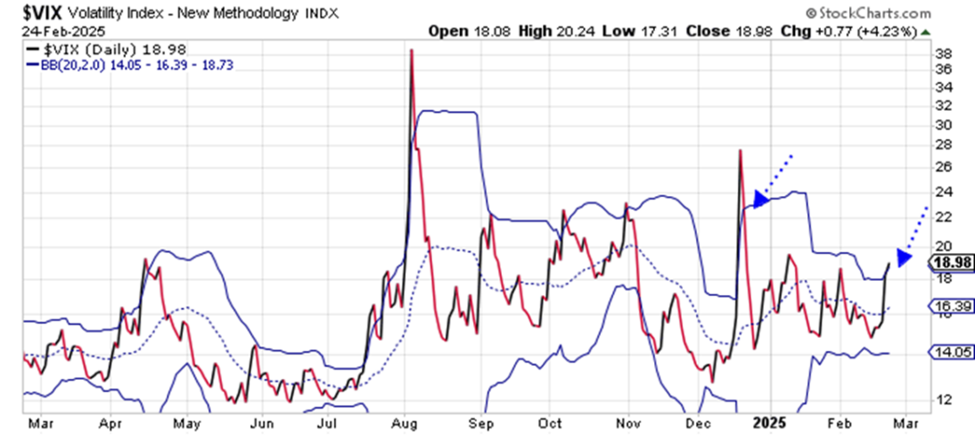 Jeff writes that when the VIX closes back inside the bands, we’ll have another VIX buy signal. Below is how things look as I write Friday morning. I’m using a 6-month timeframe so we can see the details clearer. If you can’t see it, the VIX reading is slipping just underneath the upper Bollinger Band. 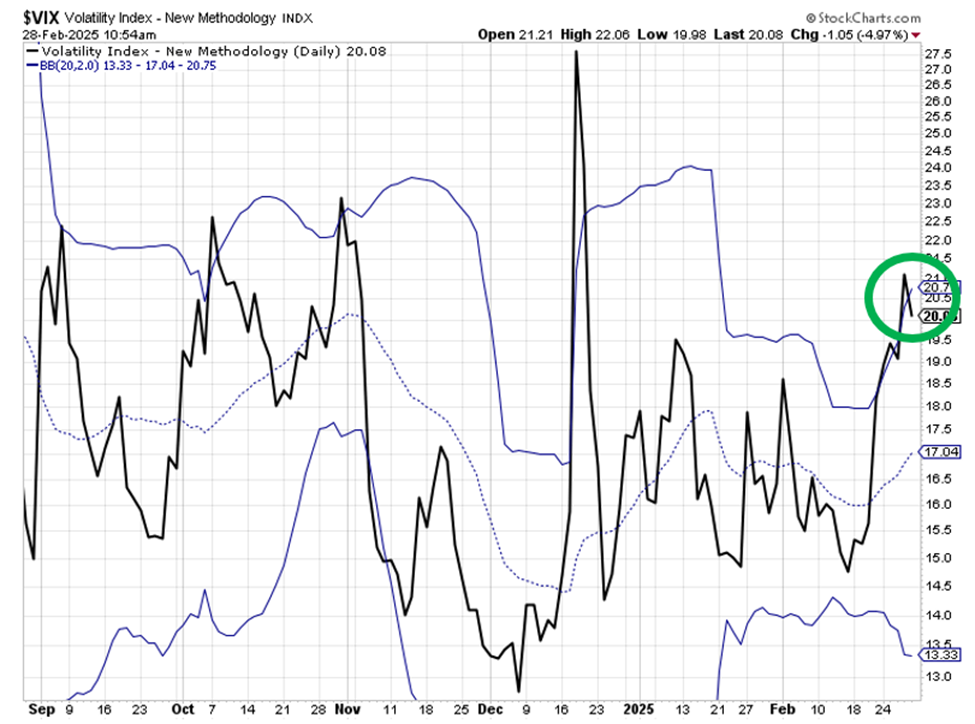 Per Jeff, we’ll need the VIX to close today back inside the band for an official trigger. But so far, so good. And at a minimum, we can say that the VIX Indicator appears very close to turning to bullish. We’ll report back. Continuing with "triggers," on the macro front, the Fed's favorite recession indicator triggered on Wednesday Now, I’ll immediately clarify that we’re not calling for a recession. That said, it’s important for investors to be aware of what’s happening. Two days ago, the 10-year Treasury yield fell below the yield on the 3-month note in what’s called an “inverted yield curve.” Regular Digest readers are familiar with this phenomenon as we’ve covered it extensively over the years. But while we usually focus on the 10-year/2-year relationship, the Fed prefers this 10-year/3-month relationship because the 3-month is more sensitive to movements in the fed funds rate. In fact, the New York Fed uses it to assess the probability of a recession over the ensuing 12-months. As of last month, that recession probability clocked in at 23%... 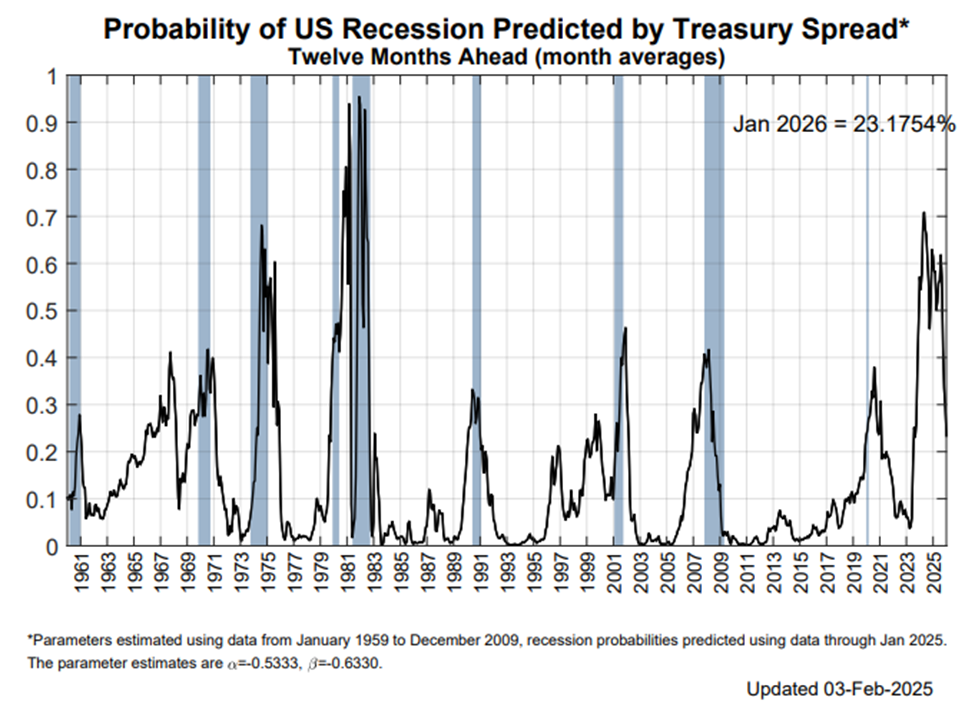 This is likely to move. Here’s CNBC: [The 23% recession probability] is almost certain to change as the relationship has shifted dramatically in February. The reason the move is considered a recession indicator is the expectation that the Fed will cut short-term rates in response to an economic retreat in the future. As we covered earlier this week in the Digest, legendary investor Louis Navellier believes the Fed will enact four quarter-point cuts this year. If that happens, our inversion might steepen or normalize based on whether Wall Street interprets those cuts as bullish or bearish (which will affect the long end of the yield curve). After all, cuts can either restore confidence that the Fed has things under control…or inflame anxieties that the Fed is behind the curve and reacting to bad economic data. For now, what we can say definitively is that the inversion does not mean an impending recession. Remember, this part of the yield curve was inverted for virtually all 2023 and 2024 (turning positive in mid-December 2024). So, while it’s something we should consider, let’s not assume the sky is falling. We’ll continue monitoring and will report back. | Recommended Link | | | | While China races to catch up, one American innovator has secured a breakthrough that could control computing’s next revolution. This company’s unique technology could potentially become as essential to AI’s next phase as Nvidia’s chips were to its first wave. Click here for the full story. |  | | Finally, let's end today with some good news If the recent market weakness has you on edge, remember… We’re in a bad part of the year for market returns. Below, we look at the S&P’s Seasonality chart, which visually represents the average returns of the S&P 500 over the average year. The short takeaway? On average, it’s always bad right now. So, don’t rush to bail on stocks. 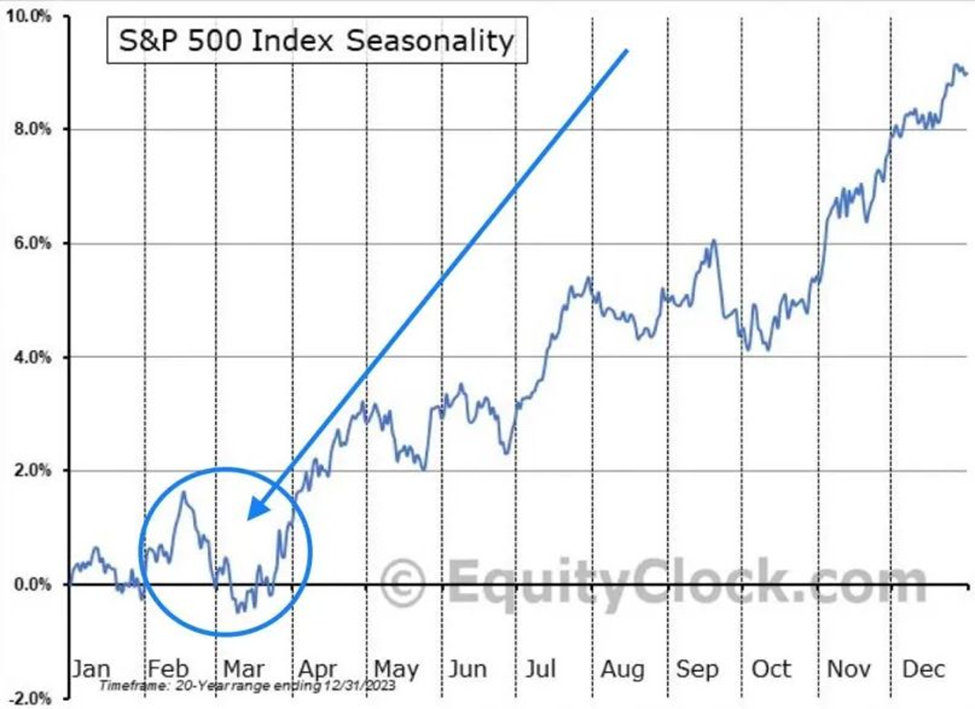 Source: Stock Pattern Pros/Tim @StockPatternPro on X / Charles-Henry Monchau The good news is that if average seasonality repeats, we’re in for another week or so of softness, then we’ll kick off a solid bull run into May. Sounds about right with Luke’s volatility prediction and Jeff’s VIX Indicator. Speaking of seasonality, back in January we profiled a new Seasonality Tool from our corporate partner, TradeSmith. It searches for historical, repeatable price patterns, specific to any given stock. Well, yesterday, Keith & Co. released their latest suite of quant tools, while also flagging a rare market pattern that’s suggesting we’re on the verge of a bullish melt-up – despite the market’s wobbles in recent weeks. It was a great evening with thousands of investors joining Keith. If you missed it, you can catch a free replay here. It covers: - What’s behind the algorithm that’s flashing a bull signal today
- 10 stocks positioned to ride a melt-up higher
- 10 “big name” stocks to sell immediately
- The perfect way to unleash TradeSmith’s cutting-edge technology on these markets for maximum profit potential
We’ll keep you updated on all these stories here in the Digest. Have a good evening, Jeff Remsburg | 


ليست هناك تعليقات:
إرسال تعليق