Plus, a list of stocks that are currently on winning streaks
 | How Stocks Tend to Perform After Extended Win Streak
|
| Meta Platforms (META) just went on an incredible run, closing higher for 20 consecutive trading days from Jan. 17 to Feb. 14. That's the longest winning streak I could find looking at current S&P 500 Index (SPX) stocks going all the way back to 2010. Since the streak, META is down over 10% in just over one week. In this article, I'm examining data on stock winning streaks to see if this type of mean reversion is typical, or if it is more likely to signal momentum and underlying strength.
Stock Performance After Winning Streaks
For the analysis below, I looked at current SPX going back to 2021. Then, I looked at the stock's next day return based on how many days in a row the stock had been up. Once the streak got past ten days, I grouped the stocks together as 11+ days.
The average next-day return for a stock based on its winning streak has an unmistakable trend. Stocks up four days in a row or more average a negative return the next day. Also, the longer the streak, the bigger the average loss the next day. Based on this, stocks look more likely to pull back the next day the longer the winning streak is. | 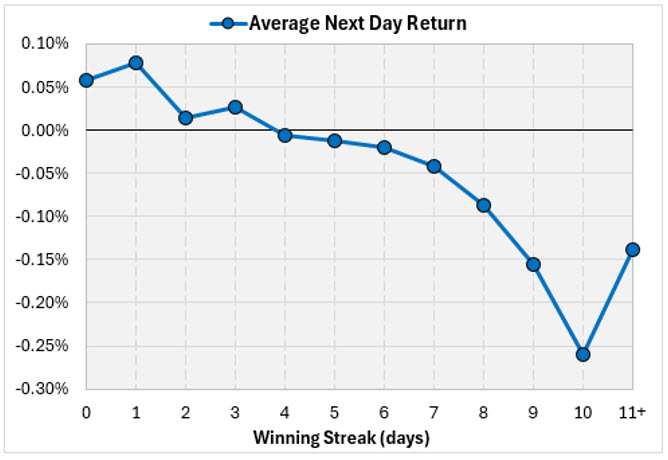 | The next chart shows how often the stock was positive based on the winning streak. Stocks were more likely to be down than up after their winning streak got to five days. The chart below looks a lot like the one above. | 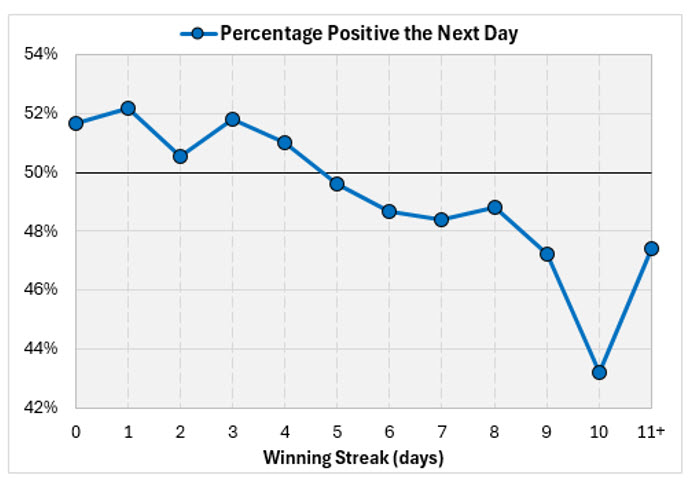 | | | This next chart shows how often the stock outperformed the SPX the next day based on the winning streak. I was a little surprised that this chart doesn't follow the same pattern as above. Stocks were slightly more likely to beat the SPX the day after a down day. After that, when the stock was up anywhere from one day to six days, it was slightly more likely to underperform the index the next day.
For some reason (most likely randomness), when a stock's winning streak got to seven and eight days, they became more likely to beat the SPX the next day. After a nine-day winning streak, stocks beat the index just 45% of the time the next day. Note that the axis in the chart below is very tight, so no matter what the winning streak is for a stock, the odds of it beating the index the next day were around 50%. | 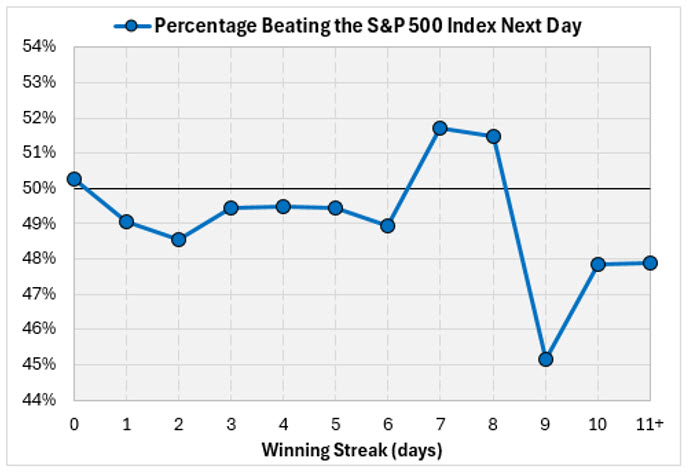 | Next, I looked at how stocks fared over the next 10 days after winning streaks. Overall, since 2021, stocks averaged a return of 0.47% over a 10-day period. Stocks beat that average by a little bit after a down day (zero-day winning streak) and were right on the average after one win.
The average 10-day return declined until the winning streak hit four days. After that, you see the returns improve and almost reach the average after an eight-day winning streak. There's a jump in the average return after 11 days or more, which I would attribute to randomness, but maybe extremely long streaks do indicate underlying strength (though that's not the case with META recently). | 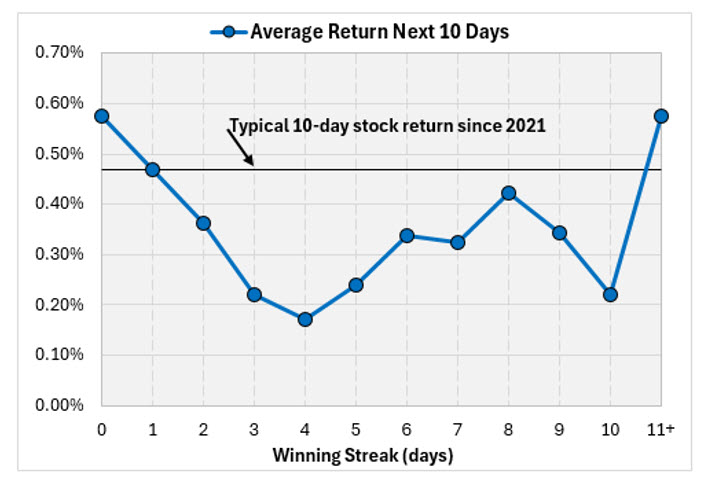 | This next chart shows the percentage of stocks beating the SPX over the next 10 trading days based on the stock's winning streak. Overall, individual stocks beat the index 48.5% of the time over 10 days since 2021. Interestingly, stocks were slightly below this when the winning streak was between one and four days.
Once the stock reached five days, the chances got better, maxing out at seven days before falling back down to the average at the longest winning streaks. Again, the axis is tight, and the odds never stray too far from 50%, but this shows perhaps there is some indication of strength the longer the winning streak goes. | 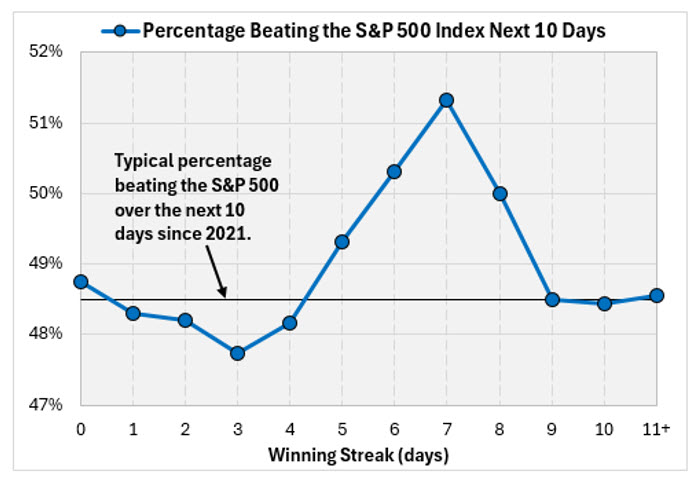 |  | | | | |
|
| | |
|
|


No comments:
Post a Comment