| | Here's What the Market Did While You Were Sleeping
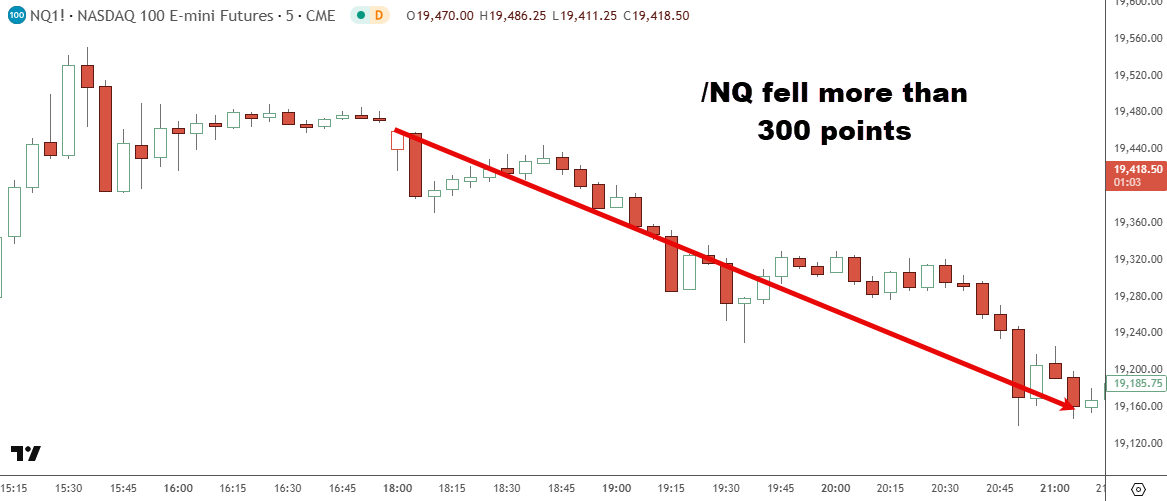
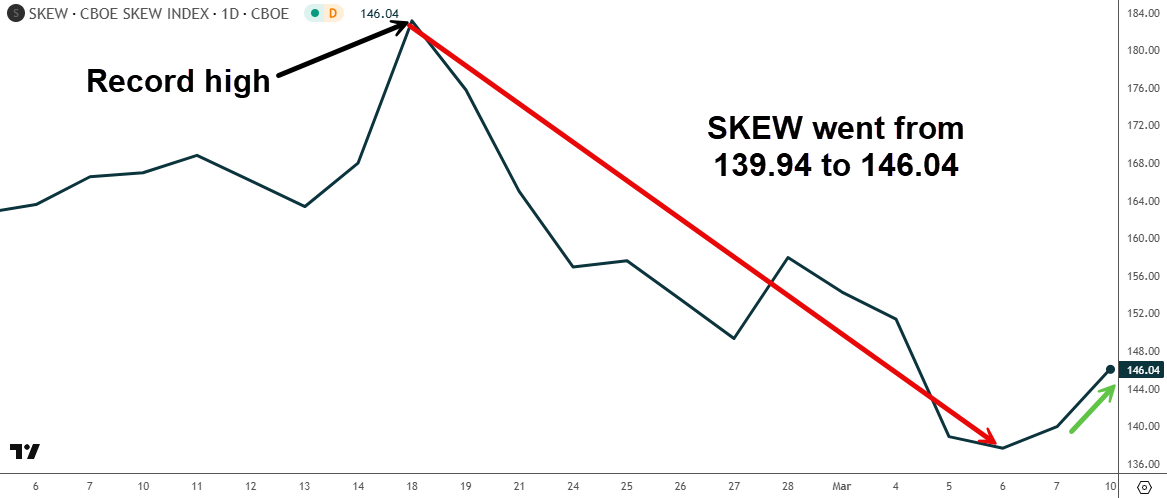
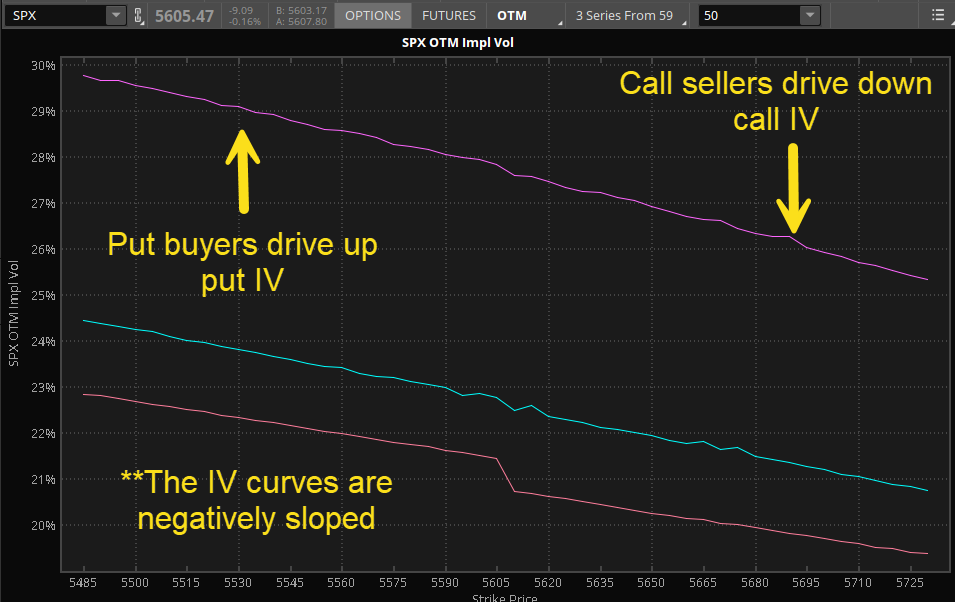
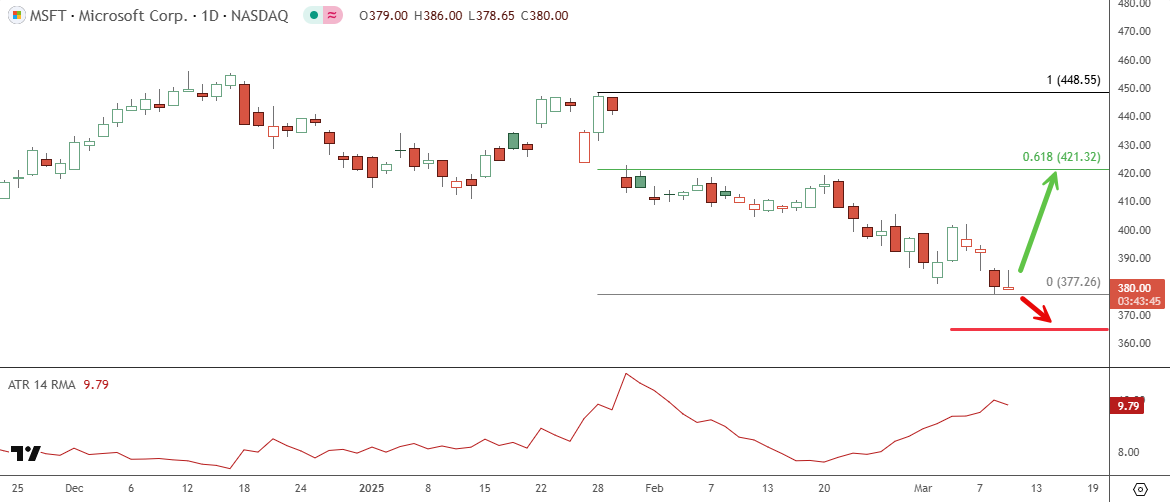
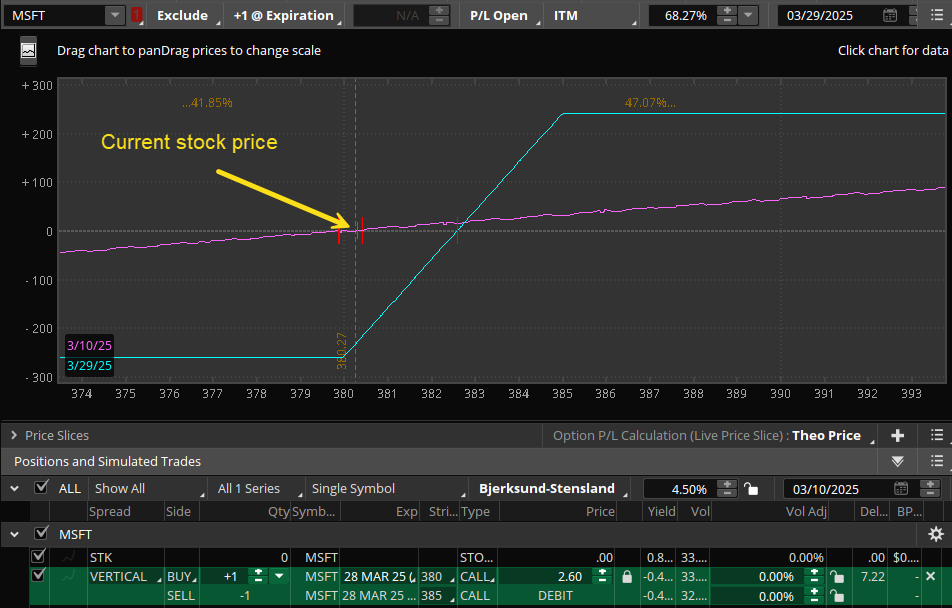
by Brandon Chapman, CMT | In case you missed it, the market was roiling last night! Just after the futures reopened, the selling began and we were being messaged from Don Kaufman. Here are some highlights: | "SKEW hit 146 today … damn that's weird" | "Buying insurance in the middle of a fire" | "Damage is imminent" | "NQ 4k here we come!" | "We are puking" | | If you know Don, he always has something to say, and his chats can be very entertaining! At the point he made his comment about the SKEW Index, I hadn't looked at the value yet since it came out after the close. To Don's point, the value was very surprising! | | | One of the keys I talked about yesterday was to see SKEW fall. This is representative of the types of hedges being deployed during a sell-off as the VIX rises. Typically, institutions are buying puts to hedge their exit from equity positions. This causes the VIX to rise and the lack of call selling causes SKEW to fall. | However, yesterday was different. | As yesterday unfolded and the S&P 500 dropped over 2%, the VIX increased six points from around 23.50 to 29.50 intraday. That is indicative of put option buying and you hope that the market is capitulating. However, the trend toward a 90% day failed, the VIX fell from its high and SKEW rose. Not exactly the selling fervor we want to see. | Why SKEW Went Up | When the SKEW Index is greater than 100, it indicates that there is a negative expected skew in the market. This happens based on the 1987 realization that the market crashes downward and not upward (novel thought!). Since that point in time, institutions typically use some variation of buying puts and selling calls, which causes the implied volatility curve for the SPX options to slope downward. | | In the above image, the more this type of hedging is being done it creates a steeper slope and a higher SKEW Index value. | What happened to the SKEW Index yesterday is that it went up rather than going down. That means that institutions were selling a decent number of calls against the puts being bought. Yes, there was an imbalance favoring the put buyers, but this isn't normal, especially for a day where the S&P 500 is down 2%. | The interpretation is that we're not normalizing upside expectations yet and the market may not be ready for a major move higher. Today's price action certainly reminds you that the selling may not be over yet. | First Mover Option Pulse | We're looking for a first-mover advantage by identifying option pulses or prints that could impact the stock price. Here is a significant print from today that aligns with yesterday's newsletter: | Microsoft Corp (MSFT) | MSFT is down nearly 18% from its December high near $455. Yesterday, I outlined my thought process of what a bottom may look like this week and MSFT was one of the companies I mentioned to look for an opportunity. While the timing of a market bottom can be difficult in a more bearish environment like this, it's important to look at what the options market is signaling. Here is a significant long call trade from today: | | How did I find this activity? I have a search that I've designed using the thinkorswim software from SCHW. While the call traded is at-the-money right now, the indication is a bullish one at such a juncture. In fact, 3,384 contracts were bought in one print! | The early bullish signs are there, but there is always the possibility of failure as nothing is 100%. However, trading is about taking calculated risks. The next question becomes how do you trade it? | The first point to make for those FOMO traders out there, this isn't likely a generational buying opportunity in MSFT. This is just a short-term oversold position and a stock that is a mega cap and is very influential. If the market goes up from here, this stock may lead. If the market goes down from here is a more controlled fashion, it may have a decent chance of holding up as other outperforming Mag 7 stocks are sold (AAPL, META). | | | As a result, it's a reasonable stock trade with a stop $15 below the entry price based on 1.5 times the daily ATR. The target is 4 times the ATR at $420, which happens to be the 61.8% retracement level from the January to March sell-off. | Option Alternative | A level 3 option alternative is to buy a call spread. | | This spread would be put on for around a $2.60 debit with a planned exit at 4.00. If the price bounces from here and passes through 385, the IV will likely fall and will help expand profitability. The risk is the $2.60 paid and so you'll need to position size around that level of risk. | | |
|


No comments:
Post a Comment