Markets Plunge: The "Red Line Indicator" Just Triggered
For years, this signal has preceded some of the most dramatic stock moves—96% on JPM, 275% on XLF, 583% on XHB—especially during times of market turmoil. Those who recognize it have a major opportunity at hand. This Thursday at 2 PM, Don Kaufman is revealing how to spot it when volatility hits—plus, an inside look at a major trade he's tracking. Secure your spot now! | | The Inflation Surprise – And What to Do About It Next
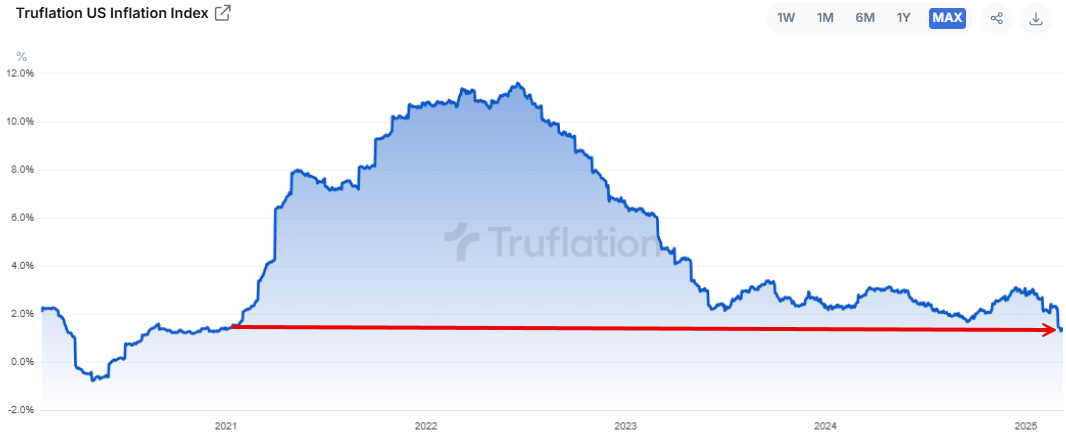
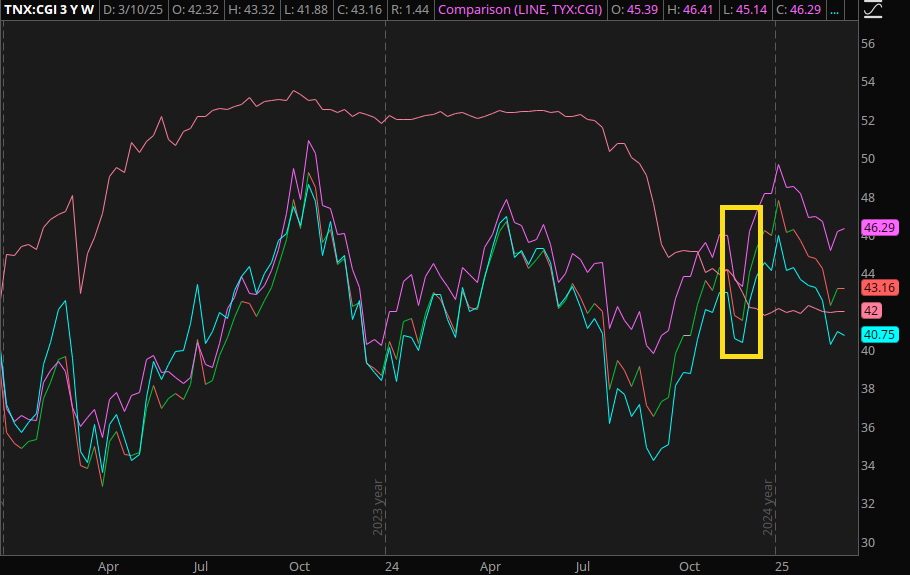
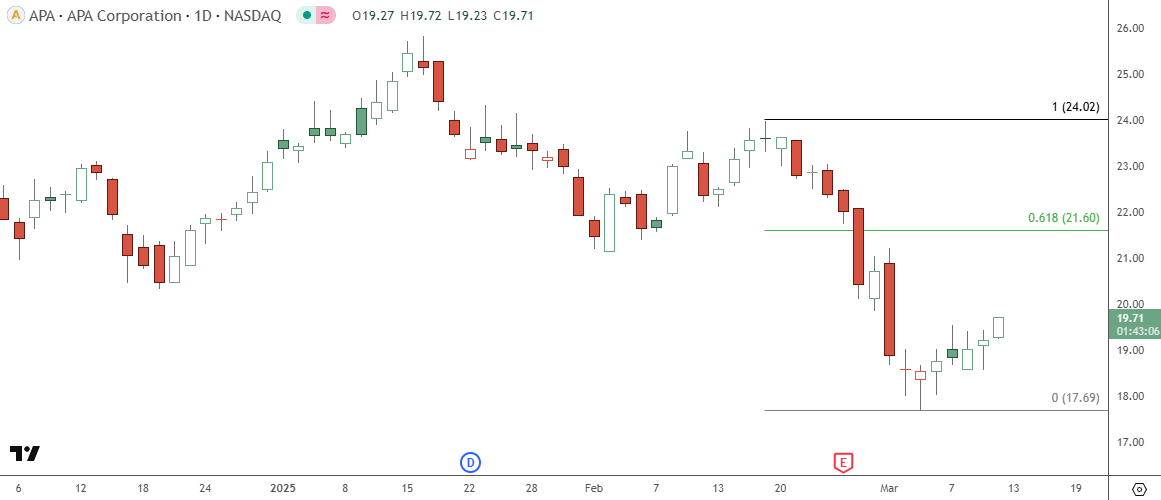
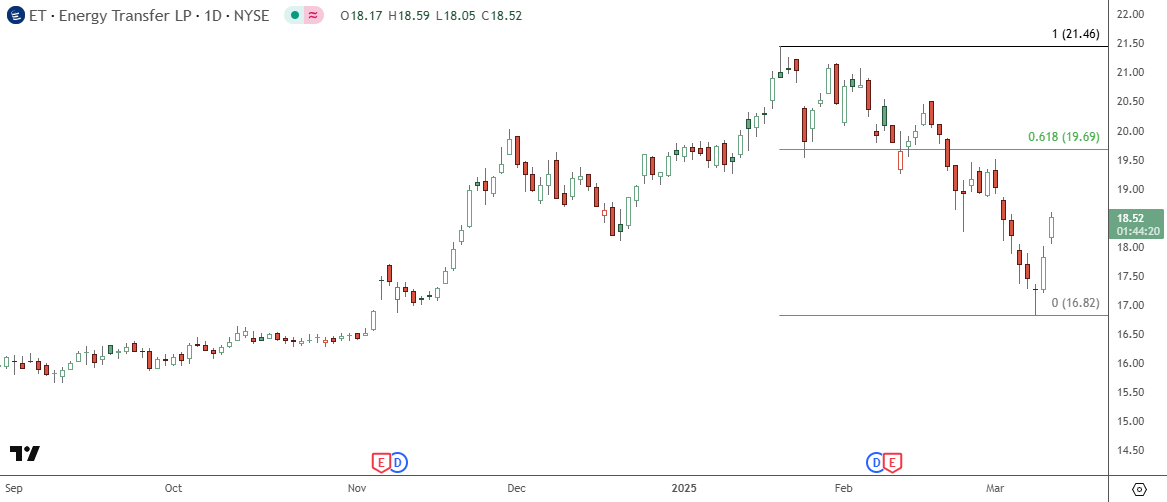
by Brandon Chapman, CMT | The CPI report was released today… and - surprise! - we came in lower than the estimates. Should this have been a complete surprise? The answer is no, of course not. There were signs in the February 12, 2025, report - one that sent the S&P 500 rallying off of the opening gap. | At the time, I talked about a couple of internals that saw significant price declines. | Also, there were sites like Truflation.com that indicated inflation was falling off the map at the beginning of March. They estimated inflation had fallen to similar levels last seen at the beginning of 2021 at 1.3%. | | | Watching long-term U.S. Treasury bonds and notes over the past two months certainly has reflected the falling inflation internals. We're now seeing the headline and core numbers come in below expectations. This dynamic is also reflected in the Treasury yield curve. | | At the end of 2022, the yield curve inverted. That means that long-term bond yields fell below short-term yields. That dynamic was very perplexing given that inflation rates were so high, but the Fed raised rates at the fastest pace in history. | While the 13-week T-bill yields were above all other maturities, the structure of five-, 10-, and 30-year Treasuries were inverted through most of 2023, but began to uninvent and steepen as the Fed began preparing to cut rates last summer. | Why is this significant? It's because the yield curve normalizing, as it did at the end of 2024 (highlighted in yellow), is a recession signal! | If we're on the cusp of recession, then why are we so concerned about inflation? That is the point of the shift in the internals in February and the signal created from the bond market. Couple that with the policy change from the Trump administration and it comes full circle to the weakness we're seeing over the past few weeks. | Let's not get too far ahead of ourselves on celebrating the idea we've conquered the inflation monster. After all, we're still above the Fed's 2% target, but we may be closer than we've been in a long time and moderating inflation. The only issue is how we further see inflation come down, and that is the big "R." | First Mover Option Pulse | We're looking for a first-mover advantage by identifying option pulses or prints that could impact the stock price. Today, we'll look at a couple of prints in the Energy sector. | I know, we just talked about inflation and recession. However, an immediate collapse in the economy may not be in the cards and recessions are acknowledged after we're knee-deep. What we're talking about is a near-term bounce in the energy sector as oil prices test major support near $66. | APA Corp (APA) | | | | Energy Transfer Partners LP (ET) | | | Both of these calls were bought, and they mark a degree of bullish short-term expectations. With oil at support and these companies having pulled back significantly off of their highs, it marks a point where an entry can be made. One caveat, ET is a master limited partnership (MLP) and has some specific tax implications, even for qualified accounts. If you're not wanting to have any extra work during the tax season, you could replace ET with another midstream company like Kinder Morgan (KMI), which I've also outlined a trade on recently. | As a heads up, tomorrow I'll outline how to analyze these companies when selling puts and buying for dividends. I'll write up something for the newsletter and cover it during my session. |
|


No comments:
Post a Comment