Large Stock Market Pullback Unlikely, Per This Fear Gauge
 | Large Stock Market Pullback Unlikely, Per This Fear Gauge |
| The CBOE Volatility Index (VIX) is widely known as the market's "fear gauge" because it measures expected volatility in the S&P 500 Index (SPX) over the next 30 days, based on at-the-money options. When uncertainty rises or stocks drop, the VIX tends to spike. However, there's another volatility index that may deserve the "fear gauge" title even more: The CBOE Skew Index (SKEW).
The SKEW measures the steepness of the implied volatility curve in SPX options. Specifically, it reflects how much more traders are paying for out-of-the-money (OTM) puts compared to OTM calls. A high SKEW suggests that traders see an increased risk of a major market drop – or even a "black swan" event.
Recently, the SKEW hit an all-time high, even as the VIX is registering between 15 and 16 – well below its historical average of around 20. This suggests traders expect moderately low volatility in the short term, but are still hedging against the possibility of a major market crash. In this article, I'll examine whether a high SKEW truly signals a greater risk of a large market decline. | 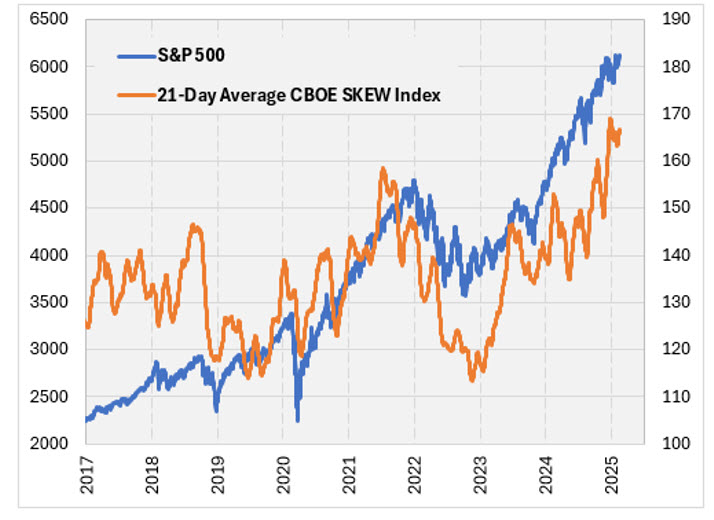 | CBOE SKEW Index
The CBOE has data on the SKEW going back to 1990. The index has ranged anywhere from 101 to its current reading of 180, with an average and median near 120. As you can see in the chart above (note that the chart is a 21-day average to smooth the line), in recent times it has typically been above its long-term average.
To see how the SPX has performed based on the SKEW reading, I went back to 1990 and separated the SKEW readings into five buckets, from the lowest to the highest readings. The buckets have roughly the same number of data points. Then, I summarized the one-month returns of the SPX for each bucket. The table below shows the results.
Interestingly, the SPX tended to lose the most when the SKEW was in the lowest bracket, and it tended to lose the least when the SKEW was in the highest bracket. Based on this, the SKEW may be a contrarian indicator. | How to achieve a 93% win rate according to this shocking study (ad) When you're BUYING speculative options, you're the gambler buying the ticket hoping for a big win. But when you're SELLING options you switch sides… You go from being the sucker just waiting to lose money to becoming the "house" and collecting money from almost every transaction. And that's exactly what makes the "60-Second Trade" work… Roger's study shows it gave folks a shot at generating extra cash flow, week after week.. Click here to jump in on the next "60-Second Trade" now |  | Here's the same method as above, but only looking at data since 2017. In more recent times, the options market hasn't done a great job of predicting huge SPX losses. Again, the smallest losses have tended to occur when the SKEW was in the highest bucket of readings.
|  | Buy the stock when it touches this ONE line on the chart (ad) Forget the 10-day, 20-day, 200-day moving average for getting your trading signals. I'll show you my most reliable, trusted, and FREE indicator you can overlay on any stock chart on any stock charting software. It's my go-to for the last 30+ years of trading full-time. You would've opened positions on Tesla, Nvidia, Netflix, you name it...all before they took off. You can get my #1 favorite indicator and my popular 23-page book on trading FREE. Click here to learn more. | One last way I quantified the SKEW data is I looking at the performance of SPDR S&P 500 ETF Trust (SPY) put options. The SPY is an ETF based on the SPX, and I'm using it because their options are extremely liquid. The data below uses returns on the SPY and actual option prices at the time to derive a daily, one-month at-the-money put option return for the ETF.
Since 2017, put options on the SPY have generally performed poorly, as stocks have generally been strong since then. They performed most poorly, however, when the SKEW was the highest, averaging a 35% loss when the SKEW was in that highest bucket of readings. If crashes tend to occur when the SKEW is highest, you might expect a lot of doubles or triples on put options. Doubles on SPY puts are most likely to occur when the SKEW is lowest. When the SKEW has been highest, the odds of a double were 14%, which is close to the average since 2017.
The likelihood of a triple was 9.1% when the SKEW was highest, which was the second-best performing bucket by that measure. Finally, you would expect a large average positive put return if crashes happened at high SKEW levels, but the average positive in that highest bucket was 216%, which was the second worst performing bucket by that measure.
|  | Maybe quantifying put returns isn't the best way to judge the performance of the SKEW, since the SKEW itself is derived from the put options. But there's nothing in the analysis above that suggests a high reading of the SKEW, like we're seeing now, indicates an increased risk of a large stock market pullback. | | | | |
|
| | |
|
|


No comments:
Post a Comment