A technical look at the S&P … the crypto pain-train rolls on … at least the 10-year Treasury yield is down … tomorrow's big event with Keith Kaplan of TradeSmith The S&P is about to make an exaggerated move. Early clues suggest the direction will be “up,” but “down” is very much in play. If the move is higher, we’re likely in for a rebound that our hypergrowth expert Luke Lango plans on buying. It could be a 3%+ surge back to all-time highs and beyond. But if the move is lower, the S&P could fall another 3% to 5% by mid-March. Behind this binary is the S&P's 100-day moving average, an important technical support level Yesterday, the S&P fell to this level, bounced slightly, and it’s sitting barely above it as I write Wednesday mid-morning. For newer Digest readers, a moving average (MA) is a line on a price chart that shows the average price of an asset over some stated period. Moving averages provide investors and traders helpful perspective on market momentum. These MA lines are important because they often trigger “buy” and “sell” decisions from the quantitative trading algorithms that drive so many professional portfolios these days. So, if the S&P begins breaking either “up” or “down” from a key MA – like the 100-day MA – those quant programs are likely to amplify the move as they join in the buying or selling. As I’ll show you below, the S&P has just bounced off its 100-day MA (the purple line) and is trying to retake its 50-day MA (in red). (The 200-day MA is in blue. More on that shortly.) 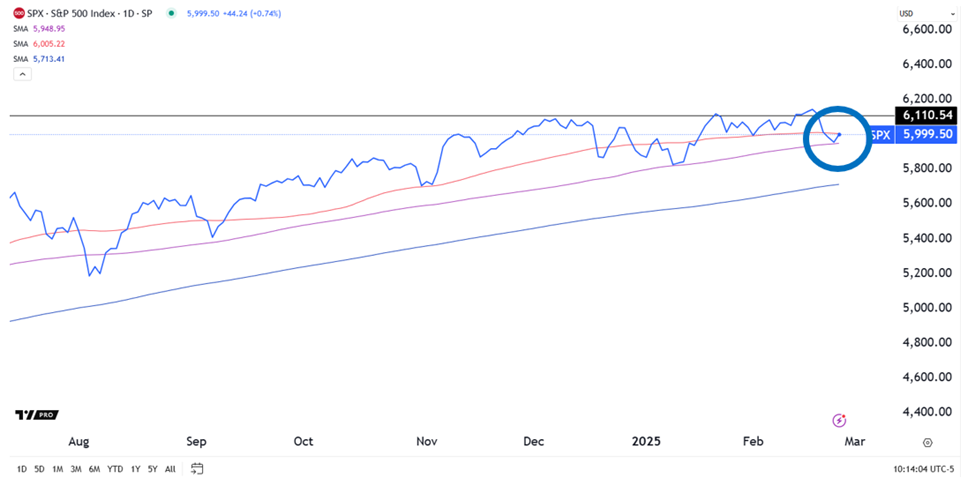 If we pull back to get a longer timeline, you’ll see that the 100-day MA has been the strongest support “backbone” of the S&P’s climb since late 2023. With one exception, each time the S&P has fallen to this level, the 100-day MA has served as a springboard, bouncing it higher. 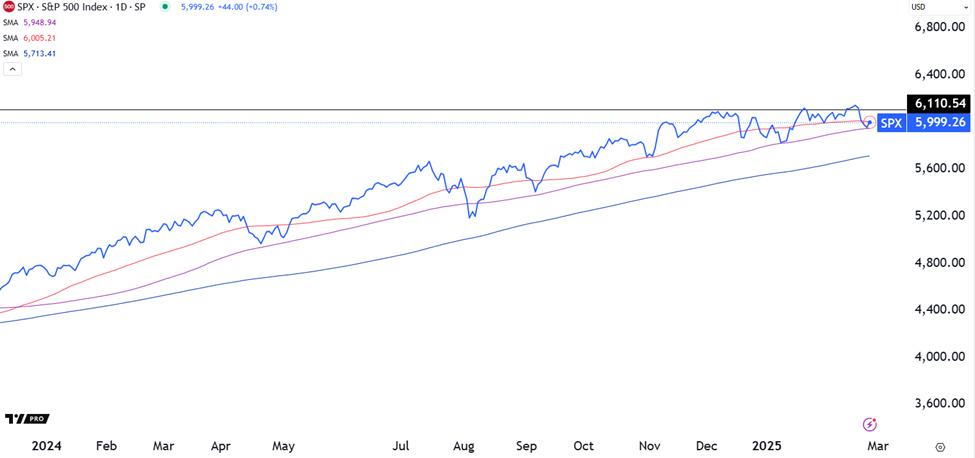 Beginning with the potential for a continuation of this bounce-and-rally, let’s jump to Luke. From his Innovation Investor Daily Notes earlier this week: Since late 2023, the S&P 500's big technical support line has been the 100-day moving average (MA).
In that time – about 15 months – the S&P 500 has only lost its 100-day once (August 2024), and when it did, the market briefly fell below that level, only to rebound sharply within days.
That means the 100-day moving average has essentially been the "bottom" for the stock market in all of its selloffs since late 2023. And that MA is just below where we trade today...
If we [hold here] and bounce… that would be a very bullish technical signal.
That's why, [Monday] morning, I told my team to get their Buy Lists ready. | Recommended Link | | | | As the markets recoil from looming trade wars, global instability, and sticky inflation… an ultra-rare pattern not seen for 29 years has emerged. Does this pattern signal more despair for investors… or perhaps a remarkable opportunity to get ahead despite the volatility? Don't miss the details at our special briefing tomorrow, February 27th. Reserve your spot now. |  | | If the S&P's bounce fizzles and it slips below the 100-day MA, it's likely to fall roughly 3% or 5% Falling 3% represents a pullback to 5,800 – about halfway between the S&P’s 100- and 200-day MAs. It’s also where the S&P found support in January. If we look at the last time the S&P lost its 100-day MA (which Luke referenced), it reversed north about halfway between these two MAs at the big, round number of 5,200. Such big, round numbers carry extra weight with traders. That’s why I’ve flagged a similar big, round number (5,800) that’s also about halfway between these MAs. A drop of 5% would take the S&P all the way to its 200-day MA. This hasn’t happened since October of 2023. What clues might give us a heads-up about upcoming direction? The S&P’s Relative Strength Index (RSI) and Moving Average Convergence/Divergence Indicator (MACD) are both trading at levels from which rebounds have occurred over the last year. The RSI has already U-turned and is headed higher. The MACD (which moves slower) hasn’t turned north yet but is inflecting, something called “bullish convergence.” 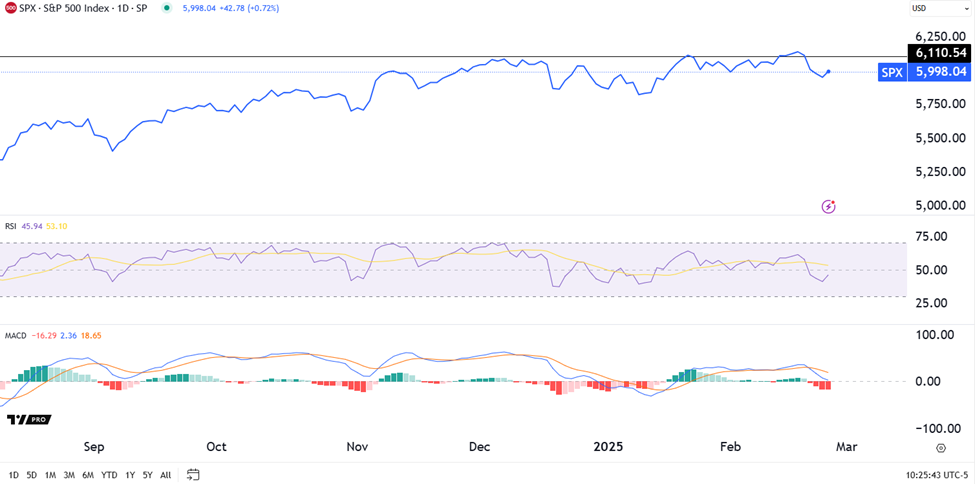 Put it altogether and we’re giving the edge to a continuation of this bounce…yet it comes with an enormous asterisk (read on for what that is) … In the meantime, get your buy list ready…and your stop-losses identified. Speaking of buying versus following your stop-losses... Bitcoin and altcoins are dropping fast. This means one of two things: - If you’re a short-term trader who bought a couple months ago, check your stop losses and protect your capital.
- If you’re a long-term believer who’s been adding to your position over time, get some dry powder ready to deploy.
As I write, Bitcoin trades beneath $88,000. Yesterday, it notched a three-month low. Behind the decline are two primary contributors: - A broad “risk off” sentiment, which has gripped Wall Street recently, has disproportionately affected Bitcoin (the poster child for risk).
- A lack of short-term catalysts to get crypto investors bullish.
On that second note, here’s CNBC: Bitcoin kicked off the year in rally mode, fueled by optimism about the positive changes the new Trump administration was expected to make for the crypto industry.
However, since the President issued his widely anticipated executive order on crypto at the end of January – the contents of which were well received by the industry despite its tamer than hoped for language on a strategic bitcoin reserve – the market has had little to look forward to. Below, we look at Bitcoin's chart, including its RSI and MACD indicators referenced above Bitcoin’s RSI level (circled in red) is 28. This is officially “oversold” territory, as well as its lowest level since August. Similarly, Bitcoin’s MACD (also circled in red) is deeply negative, signifying oversold conditions. It too is trading at its lowest level since last summer. 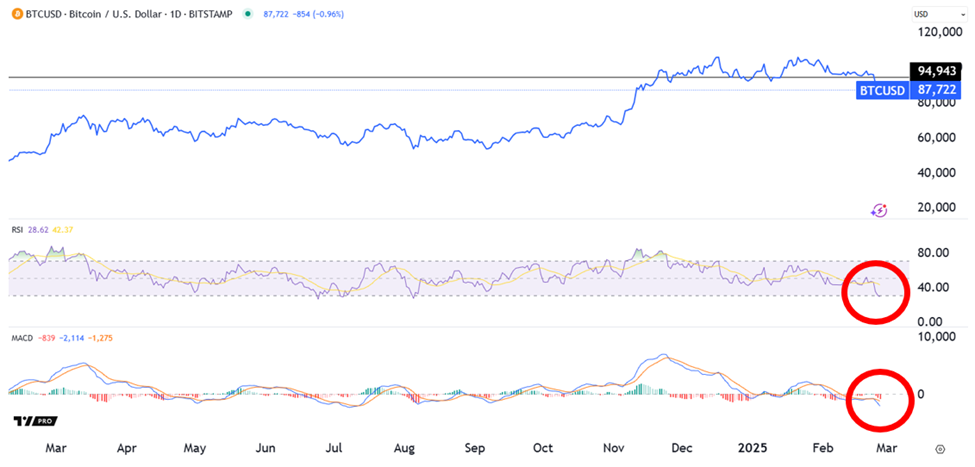 The silver lining is that these depressed levels heighten the odds of a mean reversion rally. That said, you never want to try to catch a falling knife. So, if you’re looking to add to your Bitcoin position, the safer move would be to wait until there’s more obvious strength in these technical charts. After all, the bottom could be closer to $70,000 - $75,000. We’ll continue monitoring and will report back. | Recommended Link | | | | Is this recent market drop a speed bump, or just the beginning of even worse market conditions? Tomorrow, February 27th, we’re revealing the full story behind today’s markets - and we’re not relying on emotions or doom-and-gloom headlines. We’re presenting cold, hard data. So what does the data say? Those that don’t prepare could get crushed. Those that take the right steps may never worry about shaky markets again. Don’t miss out – secure your spot for tomorrow’s big event. |  | | The falling 10-year Treasury yield is good news As regular Digest readers know, the 10-year Treasury yield is single most important number in the global financial market. The higher it climbs, the more pressure it puts on most stock prices (and Bitcoin’s price) because a higher yield means a higher discount rate, which lowers the current valuation of a stock. This week, as scared investors rotated out of stocks into bonds, all that buying pressure pushed prices higher…which drove yields lower. Yesterday, the 10-year Treasury yield touched 4.28%, its lowest level since December. It’s only slightly higher at 4.30% as I write. And if legendary investor Louis Navellier is right, it will be heading even lower when the Fed cuts rates more than expected later this year. From Louis’ Growth Investor Flash Alert podcast: The 10-year Treasury yield is down under 4.3%, so that's very bullish.
So, now everybody's expecting at least two Fed rate cuts. You're going to have four this year, folks, because things are so bad in Europe that the central banks there are going to be cutting at least four to five more times, in addition to the rate cuts they've already had this year. In past podcasts, Louis has clarified that global central banks often move in parallel fashion. So, Louis believes outsized cuts from the ECB is likely to put pressure on the Fed to make similar cuts. Now, as you’ll see below, this is not what Wall Street currently predicts. The CME Group’s FedWatch Tool puts the heaviest odds (33.2%) on just two quarter-point rate cuts by December. 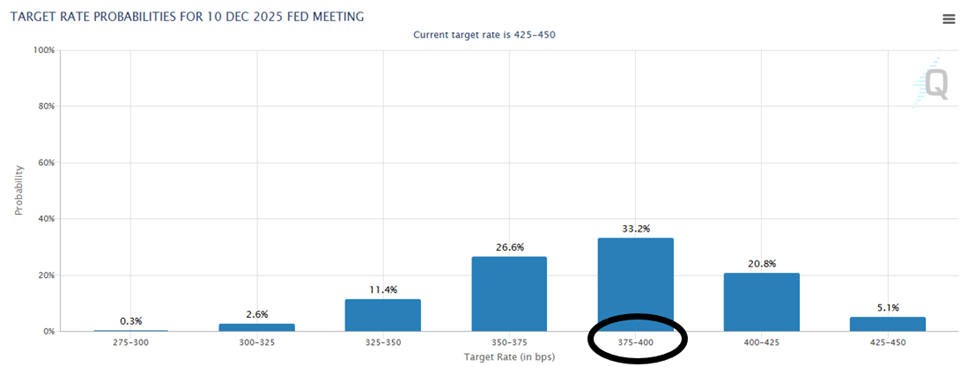 So, four quarter-point cuts would certainly surprise Wall Street. The question is “would that be a good or bad surprise?” After all, while one interpretation is bullish… "Four quarter-point rate-cuts? Wow, this will juice the economy and take pressure off stock valuations! Time to buy stocks." But a second interpretation is bearish… "Four quarter-point rate-cuts? Wow, how bad is the economy that the Fed is slashing rates 100 basis points despite the lingering threat of reinflation? Time to sell stocks." We’ll be watching. Returning to that asterisk from above... How did Nvidia earnings come in? Depending on when you read this, Nvidia may have already reported earnings after the closing bell. Did they beat? Is guidance bullish? If so, coming full circle to the top of today’s Digest, we’re likely in for a continuation of the bounce off the 100-day MA tomorrow. But if earnings disappoint, we’re likely losing the 100-day MA. Now, even if Nvidia stumbles and the market falls in the morning, Keith Kaplan, the CEO of our corporate partner, TradeSmith, believes a melt-up is coming over the next 12 months. And that would mean a pullback tomorrow could present some fantastic buying opportunities. From Keith: The markets today are frothy, to be sure, but our indicators are still very much bullish.
So, I'm staying fully invested, but I'm much more regimented than I've ever been when it comes to investing. As we’ve been covering here in the Digest over the last week, tomorrow evening at 8 PM Eastern, Keith is holding a live event called The Last Meltup. He’ll be explaining why he sees stocks moving higher over the coming months, as well as a suite of investment tools we’ve profiled this week that have helped Keith be “much more regimented,” as he just noted. As to the possibility of a melt-up, TradeSmith uses algorithms to spot repeating patterns in decades worth of stock market data. And today, it’s flagging a rare pattern that hasn’t been seen in 30 years. It’s only been seen twice before going back to 1900 – in 1966 and 1925. And it signals a type of melt-up that creates hyper-exaggerated gains (though brutal losses when the fireworks are over). The last time this happened, you could have made 9,731% from a leading software company… 28,894% from a robotic visionary… 70,626% from an internet services company… and 91,863% from a consumer electronics stock. But on the other side of those gains was a market freefall that you wanted to avoid. Keith will cover all this tomorrow, illustrating how to benefit from the ride up while sidestepping the worst of the elevator shaft down. We’ll keep you updated on all these stories here in the Digest. Have a good evening, Jeff Remsburg | 


ليست هناك تعليقات:
إرسال تعليق